News
This Diagram Turns Music Theory Into A Breeze
Whether it be understanding chord configurations or the vast sea of musical scales, music theory can definitely become baffling. Similar to a written language in which the connections between letters form words, the musical alphabet from notes A to G have their own set of relationships, forming a myriad of scales and chords.
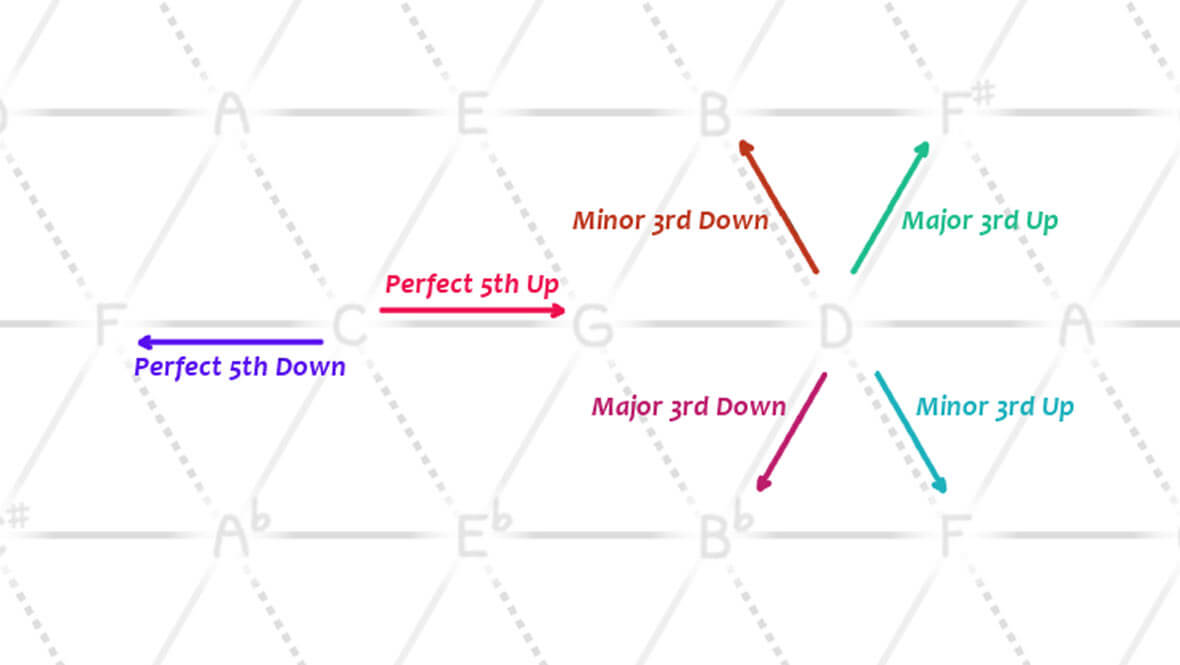
There are many visual models that help us understand musical note relationships, and one of these, brought to our attention by redditor 4plus1, is the Tonnetz. As you can see in the picture below, the Tonnetz is a lattice diagram that displays the intervals of perfect 5ths, major 3rds and minor 3rds throughout the chromatic scale.
Provided by redditor 4plus1’s image gallery,
Put simply, a Tonnetz is built by stacking fifths and thirds until you end up with a continuous, endlessly repeating net.
Horizontal lines represent intervals of perfect fifths (up or down). (D is a perfect fifth above G, which is a perfect fifth above C, and so on…)
Solid, diagonal lines represent intervals of major thirds (up and down). (F# is a major third above D, which is a major third above Bb, and so on…)
Dotted, diagonal lines represent intervals of minor thirds (up and down). (Eb is a minor third above C, which is a minor third above A, and so on…)
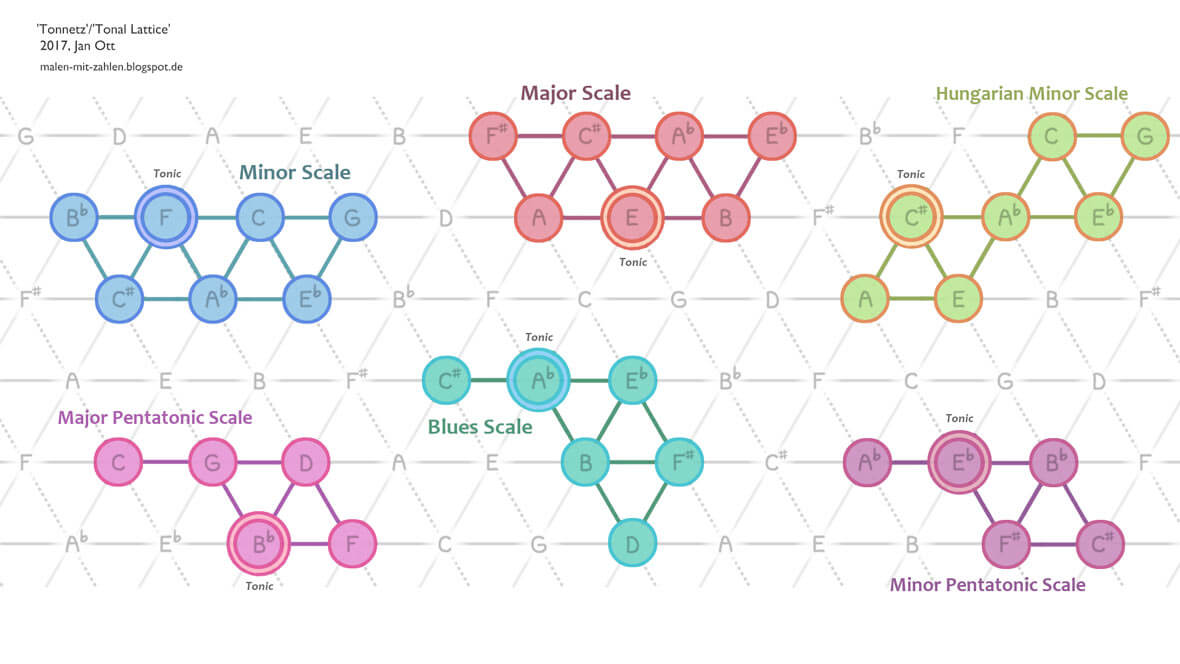
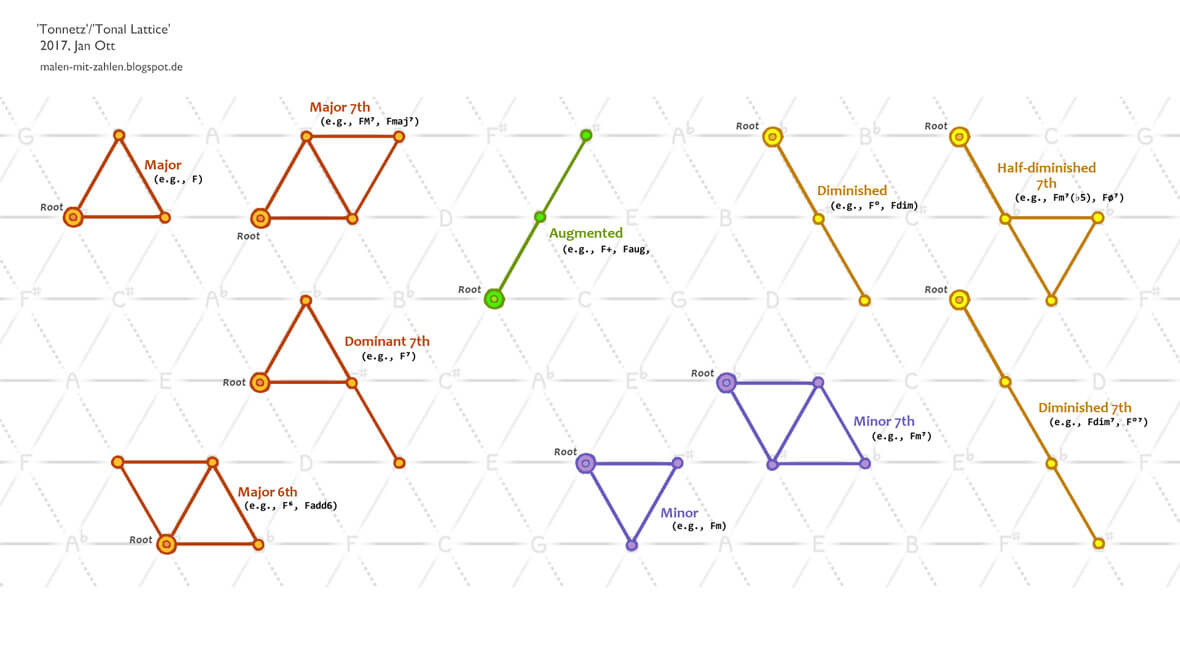
The picture below displays various chord shapes that can be constructed with the Tonnetz. This is probably the best demonstration of how useful the lattice diagram can be.
If you are interested in learning more about the Tonnetz, we suggest you visit this image gallery as well as browse the discussion on 4plus1’s Reddit thread.
RECENT ARTICLES